The U (Utilization) command displays the current system utilization statistics.
For systems that support SLICERATE adjustment, the lower the SLICERATE-that is, the fewer the number of process switches per second for a given priority-the better compute-bound tasks run. Up to a point, the higher the SLICERATE, the better I/O-bound tasks run. For a general mix, the SLICERATE should be in the range from 30 to 90 slices per second. The most efficient tuning usually comes from using a moderate SLICERATE and tiered job priorities, where the system gives compute-bound jobs relatively lower priorities and I/O-bound jobs relatively higher priorities. The risk of setting a SLICERATE too low is poor I/O service. The risk of setting a SLICERATE too high is poor processor utilization, because the processor must switch between stacks at a much higher rate, which makes poorer use of processor memory caching.
The U command can be a parameter for time-driven automatic display mode (ADM). For information, refer to ADM (Automatic Display Mode).
The U command displays the number of standard and special purpose processors. A nonzero value for the special purpose processors implies that a number of active Java processors are on the system.
Syntax
Explanation
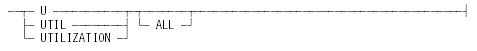
U
UTIL
UTILIZATION
Display the current system utilization statistics, including percentages of central processor unit (CPU), I/O, master control program (MCP), and total system use. The statistics display is always divided into two parts: processing utilization statistics and I/O utilization statistics. It includes disk cache and memory disk utilization statistics if the system is using these features.
U ALL
UTIL ALL
UTILIZATION ALL
Display only the processing utilization statistics for all active processor sets on the system. I/O, disk cache, and memory disk statistics are not included in the display when the ALL option is used.
Examples
Example 1
The following example shows the response to the basic U command:
U
----------------------------- SYSTEM UTILIZATION ------------------------------
-------- STD:0 CPM Statistics --------  ------------ IO Statistics -----------
User       = 96 %  Initial Pbit =  1 %  User  =  2,507 IO/Sec (  26,440 KB/Sec)
IO Finish  =  1 %  Other Pbit   =  0 %  MCP   =     75 IO/Sec (     435 KB/Sec)
MCP        =  2 %  True Idle    =  0 %  DC    =    121 IO/Sec (      37 KB/Sec)
Search     =  0 %  False Idle   =  0 %  Total =  2,702 IO/Sec (  26,911 KB/Sec)
          4,393 Process-switches/sec             2,484 IO - Interrupts/Sec
 CPMs:  6 Standard,  0 Special Purpose
------------- Disk Cache -------------  ------------ Memory Disk -------------
Total =  2,434 Rq/Sec ( 18,825 KB/Sec)  User  =      0 IO/Sec (       0 KB/Sec)
Readhits/Requests    =   4 %            MCP   =      0 IO/Sec (       0 KB/Sec)
                                        Total =      0 IO/Sec (       0 KB/Sec)
Example 2
The following example shows the response to the U ALL command:
U ALL
  ----- Standard IP Statistics --------
  User      = 45 %  Initial Pbit =  4 %
  IO Finish =  1 %  Other Pbit   =  0 %
  MCP       =  2 %  True Idle    = 50 %
  Search    =  0 %  False Idle   =  0 %
  2,491 Process-switches/sec  Ips = 6

   --------Java IP Statistics ---------
  User      =  5 %  Initial Pbit =  0 %
  IO Finish =  1 %  Other Pbit   =  0 %
  MCP       =  1 %  True Idle    = 93 %
  Search    =  0 %  False Idle   =  0 %
  273 Process-switches/sec  Ips = 2
Example 3
The following example shows the response to the U ALL command for a system that supports custom processor sets:
U ALL
  ----- STD:0 IP Statistics --------
  User      = 45 %  Initial Pbit =  4 %
  IO Finish =  1 %  Other Pbit   =  0 %
  MCP       =  2 %  True Idle    = 50 %
  Search    =  0 %  False Idle   =  0 %
  2,491 Process-switches/sec  Ips = 6
  ---- STD:1 IP Statistics ----
  User      =  5 %  Initial Pbit =  0 %
  IO Finish =  1 %  Other Pbit   =  0 %
  MCP       =  1 %  True Idle    = 93 %
  Search    =  0 %  False Idle   =  0 %
  273 Process-switches/sec  Ips = 2
Considerations for Use
Processing Utilization
The processing utilization time is divided into eight components, each described as a percentage of the last time interval. The time interval can vary, and is set with the SBP (System Balancing Parameters) command.
On systems that support multiple processor sets, the processing utilization percentages reflect only that time that can be attributed to processors running in the standard processor set. Use the ALL option to report processing utilization for all active processor sets.
The percentage for a component is calculated by dividing the processor time accumulated during the interval for that component by the summation of the processor times accumulated for all the components during the interval. Reduce capacity is not one of the components in this calculation.
|
Component |
Description |
|---|---|
|
User |
The percentage of processor time spent in user stacks, excluding time charged to other accounts such as IOFINISH or INITIALPBIT. User stacks include user programs, job stacks, and library maintenance. Other independent runners are not included. |
|
I/O Finish |
The percentage of processor time spent handling I/O completion. |
|
Initial Pbit |
The percentage of processor time spent making arrays and code present initially. The displayed value does not include time spent overlaying existing data to make room for new data. (Overlay time is charged to the OTHERPBIT and SEARCHLEAD accounts.) A presence bit (p-bit) on a read-write array is considered initial if it has not been used previously (it is not overlaid). A p-bit on a read-only array or a code segment is initial if it has not been used during the current instance of the code stack. (When two stacks run the same code file at the same time, they often share a single code stack.) |
|
Other Pbit |
The percentage of processor time spent making arrays and code present again after they were overlaid, and time spent overlaying existing data to make room for new data. (Time spent searching stacks during the overlay process is not included.) When other pbit times are being collected during demand overlay, the pbit is charged against a global pbit account, rather than against any task. The U command display and FIND MIX are both accurate, but FIND MIX does not find globally charged times. |
|
MCP |
The percentage of processor time charged to the combination of the following accounts:
|
|
Search |
The percentage of processor time charged to the combination of the following accounts:
|
|
True Idle |
The percentage of processor time spent idle that is not considered to be false idle time. |
|
False Idle |
The percentage of processor time spent idle while overlaid data is being transferred by the I/O subsystem. The term false idle is used because during this time the processor might have been working on tasks waiting for overlay I/O operations if overlays were not needed. The false idle percentage indicates that overlay is causing some tasks to experience increased turnaround time. It is not necessarily a measure of how much work exists that would be performed if overlay were not a factor. Using OLAYGOAL for algorithms can force overlay, and lead to false idle time. If the number of idle processors exceeds the number of tasks that are waiting for overlay I/Os and other PBIT I/Os to complete, the number of processors whose time is charged to false idle is equal to the latter number. |
|
Process-switches/sec |
The number of process switches that occur per second. A process switch occurs when a processor stops executing a particular process and begins executing a different process. On a multiprocessor system, this value is the sum of all process switches performed on all the processors per second. |
I/O Utilization
The I/O utilization statistics are divided into five components. Each component is described in rates calculated over the last time interval. The time interval can vary, and is set by the SBP command.
|
Component |
Description |
|---|---|
|
User |
The average number of user I/O operations per second and the number of kilobytes of data transferred per second by user I/Os. |
|
MCP |
The average number of MCP I/O operations per second and the number of kilobytes of data transferred per second by MCP I/O operations. MCP I/O operations include such functions as overlay and logging. |
|
DC |
The average number of data comm I/Os per second and the number of kilobytes of data transferred per second by the data comm I/O operations. Data comm I/O operations transfer messages between EDCDLPs, DCHAs, or ICPs. |
|
Total |
The total system I/O activity made up of user I/O operations and MCP I/O operations (plus or minus 1). |
|
I/O Interrupts |
The average number of I/O interrupts per second during the time interval. |
These components are repeated if memory disk is used, with the exception of data comm I/O. The memory disk utilization data includes I/O for memory disk units only.
Disk Cache Utilization
The following disk cache utilization statistics are reported if the system is using disk cache:
-
The number of requests presented per second to disk cache
-
The effective data rate represented by these requests
-
The percentage of these requests that are read hits
For more information on disk cache utilization, refer to the Disk Cache Module Installation and Operating Guide.
