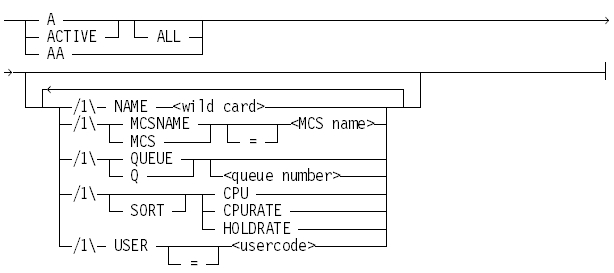
The A (Active Mix Entries) command lists all or selected active jobs, tasks, database stacks, and freeze control libraries in the mix.
Syntax
<wild card>

<delim>
One of the following characters:
/ \ I ~ ! @ # $ % ^ & * '
The first delimiter must be the same as the second delimiter.
<wild-card string>
A string of characters used to search for a task name. The string can include the following special characters.
|
Character |
Description |
|---|---|
|
Equal sign (=) |
Matches any sequence of characters |
|
Question mark (?) |
Matches any single character |
|
Tilde (~) |
Matches any sequence of characters except a slash (/) |
The wild-card string is automatically uppercased, except for characters enclosed in quotation marks, and the system stops processing the string when it encounters a space character.
You can include lowercase characters and space characters by prefixing the wild-card string with LIT and enclosing the wild-card string in delimiters.
For example, if you enter the following syntax, the system returns entries that contain the string "PACK":
A NAME =pack=
If you enter the following syntax, the system returns entries that contain the string "pack":
A NAME LIT ^=pack=^
Explanation
A
ACTIVE
Display all active jobs or tasks that have not been suppressed by the SUPPRESS (Suppress Display) command or automatically suppressed by the SUPPRESSED option of the MP (Mark Program) command. Display of jobs, freeze control libraries, and database task stacks is controlled by the value of the SUPPRESSACTIVE system option; for the purpose of this option, jobs include active jobs and tasks with no parent.
A ALL
AA
Display all active jobs or tasks, including any that were suppressed, either by the SUPPRESS (Suppress Display) command, the SUPPRESSED option of the MP (Mark Program) command, or by the setting of the SUPPRESSACTIVE system option.
A NAME <wild-card string>
Displays all active tasks with names that match the designated wild-card string, including any that were suppressed. You can use this option with other options such as A NAME <wild-card string> SORT CPU.
A MCSNAME = <MCS name>
A MCS = <MCS name>
Display only active jobs or tasks that originated from the specified message control system (MCS).
A QUEUE
A Q
Display all active jobs or tasks initiated from any queue.
A QUEUE <queue number>
A Q <queue number>
Display only active jobs or tasks initiated from the specified queue.
A CPU
A CPURATE
A SORT CPU
A SORT CPURATE
Displays active jobs or tasks and their CPU processor time used (CPU) or their CPU processor rate (CPURATE). If the SORT option is used, the display is in the order of decreasing central processing unit (CPU) time used, decreasing CPU rate.
The CPURATE option causes the display of processor time used (CPU Time column) to be replaced with the recent processor rate as a percentage (CPU Rate column). This rate shows the ratio of processor time divided by a recent elapsed time interval. If the interval is 20 seconds (the default), the MCP computes the processor rates of each task every 20 seconds and displays the percentages in a CPU Rate column. For example, a task using 2 seconds of CPU time during the last 20 seconds would have a CPURATE of 10% if the default time interval is in effect. This option enables you to determine which tasks are currently using the most system processor resources.
-
Use the SBP (System Balancing Parameters) command to specify the time interval for CPURATE calculations.
-
If the SORT option is used, the output is limited to the number of processes that can fit in approximately 10 pages of the display.
A HOLDRATE
A SORT HOLDRATE
Displays active jobs or tasks and their hold rate. If the SORT option is used, the display is in the order of decreasing hold rate.
The hold rate is calculated as the amount of time that a task is held out of the ready queue divided by the time interval specified by the CPURATE option of the SBP (System Balancing Parameters) command. A task is held out of the ready queue if
-
The task has a nonzero CPURATEBIAS value and its CPU processor rate (CPURATE) has exceeded that value.
-
The task has a nonzero I/O delay or Enterprise Database Server delay (DMSDELAY) value and the accumulated values have exceeded the I/O delay threshold or Enterprise Database Server delay threshold respectively.
-
The task has been suspended by the Workload Manager.
All these actions are associated with control by a Workload Manager.
-
Use the CPURATE option of the SBP (System Balancing Parameters) command to specify the time interval for the hold rate calculations.
-
If the SORT option is used, the output is limited to the number of processes that can fit in approximately 10 pages of the display.
-
Unlike the corresponding CPURATE modifier, a process with a hold rate of 0 (zero) is not listed in the response.
A USER <usercode>
Displays only active jobs or tasks running with the specified usercode.
| Note: | MCSs and tasking programs do not show up when filtered by usercodes. |
Examples
Example 1
A
  ---Mix-Pri--CPU Time---------- 93 ACTIVE ENTRIES -------------
   12828  50       :00 Job FROMQUEUE3
    5456  50       :00 Job J
   19149  80       :05 Lib *SYSTEM/NXSERVICES/SERVER
   19148  80       :03 Job *SYSTEM/CANDE
   19241  80       :00     *CANDE/STACK02
   19221  50       :00     COMS/DTP/MONITOR
   19218  80       :03 Lib *SYSTEM/COMS/PSH/TTP
   19217  80       :01 Lib COMS/PA/FACILITY
   19197  50       :00     *SYSTEM/MCPSERVER/COMSTP
  E 5510  80     14:17     (NORM) *DCALGOL (NORM)OBJECT/SYMBOL/NED
                           ON PACK
  * 5483  50       :05     (NORM) *DCALGOL (NORM)OBJECT/SYMBOL/XPD
Work Flow Language (WFL) jobs do not appear if they are waiting for a task to complete.
The heading line appears on the first page of the Active Entries display and before the active mix entries in automatic display mode (ADM). The number in the heading indicates the total number of active entries, including suppressed entries.
At the beginning of each entry line, an E indicates that a syntax error was discovered during compilation. An asterisk (*) indicates that the task is being displayed for the first time.
The Mix field shows the job or task mix number of the active entry. To determine the number of the job that started a task, refer to the Y (Status Interrogate) command.
The Pri field shows the priority of the job or task.
The CPU Time field shows the accumulated central processor time for each displayed task. A maximum of 999 hours can be displayed. If the SORT CPU option is specified in the command, the display is sorted according to decreasing CPU time used. The job or task that has used the largest amount of CPU time is the first item displayed. If an entry is greater than 999, the field is set to the following value to indicate an overflow condition:
***:**:**
The next column contains the word Job if the task has no parent, Lib if the task is a library process, or DBS if the task is a database stack. Otherwise the column is blank.
The usercode of the originator appears before the job or task name. Some tasks and jobs can have two usercodes shown for the following reasons:
-
One usercode indicates the USERCODE attribute of the task or job.
-
The other usercode is part of the NAME attribute of the task or job. This usercode is one of the following:
-
The usercode that the code file is stored under (an external procedure).
-
The usercode that the parent of the task or job had when the system initiated the task or job (an internal procedure).
-
Compiler tasks display with the following format:
<task usercode> <compiler name> <code file name>
Tasks other than compiler tasks display with the following format:
<task usercode> <task name>
Throughout the Active Entries display, fields are wrapped around if they need extra space. The next line begins in the first column of the field. In the example, the name information for task number 5510 is continued on another line, beginning in the first column of that field. However, fields are not wrapped if TRUNCATE = TRUE for ADM.
Example 2
This example shows the command and response for a specific queue:
A QUEUE 5
  --Mix-Pri--CPU Time--------- 8 ACTIVE ENTRIES QUEUE=5 -------------------
  6524  50       :00 Job (SPI) (SPI)RUNMONITOR
  6525  50       :00 LIB (SPI) (SPI)OBJECT/SPIMON/PROGRAM/TASKMASTER ON DISKB
  6533  50       :02     (SPI) (SPI)OBJECT/SPIMON/PROGRAM/SYSTEMINFO ON DISKB
  6528  50      1:14     (SPI) (SPI)OBJECT/SPIMON/PROGRAM/LOGEXTRACTOR ON DISKB
  6527  50       :07     (SPI) (SPI)OBJECT/SPIMON/PROGRAM/UTILIZATION ON DISKB
  6526  50       :00     (SPI) (SPI)OBJECT/SPIMON/PROGRAM/FILESHIPPER ON DISKB
  6459  50       :01     (OPS) *OBJECT/AUTOLABEL
Example 3
This example shows the command and response for the USER option when no usercode is specified. The command lists the programs running without a usercode.
A USER=""
  ---Mix--Pri--CPU Time-----16 ACTIVE ENTRIES USER= ----------
  5989   80        :07 Job *SYSTEM/CANDE3 ON CANDE
  6297   80        :01     *CANDE3/SERVANT01
  5993   80        :03     *CANDE3/STACK01
  5992   80        :04     *CANDE3/STACK02
  5991   80        :10     *CANDE3/STACK03
  6701   50        :05 Lib *SYSTEM/MSNET/SUPPORT
  6683   50        :00 Lib *SYSTEM/DTS/SUPPORT
  6702   50        :00     *DTS/PIPEHANDLER
  6644   50        :08 Lib *SYSTEM/MARC/COMMANDER
  6638   50        :56 Lib *SYSTEM/DTP/TM ON DISKB
  6624   50        :51 Lib *SYSTEM/DSSSUPPORT/DIAGNOSTICS
  3674   75        :00     STATUS/CHANGE/MP051
  3666   75        :00     STATUS/CHANGE/MP050
  3663   75        :00     STATUS/CHANGE/MP003
  3617   75        :00     STATUS/CHANGE/ECCSA
  3209   50        :18     ODT/HANDLER
Example 4
This example shows the command and response for the SORT CPURATE option:
A SORT CPURATE
  ---Mix--Pri--CPU Rate----18 ACTIVE ENTRIES (ALL) SORT CPURATE--
  6647   50    2.21%    *SYSTEM/MCPSERVER/COMSTP
  6664   75    0.59%    TCPIP/IP/7000/1
  3590   80    0.14%    (SILVA) *SYSTEM/NXSERVICES/FILESERVER
  6666   75    0.12%    TCPIP/BUFFER/7000/1
  6458   50    0.09%    (SITE) (SITE)OBJECT/UCF/MONITOR
  2823   55    0.09%    (X) (SITE)OBJECT/UTIL/RUNPM ON PACK
  6669   75    0.08%    TCPIP/MSS/DATA/7000
  6456   80    0.6% Job GRAPHDEBUG_LOGGER
  6614   52    0.5%     CCF/LOGON/PORT_IN_HANDLER
  6668   75    0.3%     TCPIP/MSS/CONTROL/7000
  6665   75    0.2%     TCPIP/ARP/700/1
  6451   50    0.1% Lib *SYSTEM/ASSISTANT
The CPU Rate column shows the recent processor rate (processor time divided by elapsed time) as a percentage of the total CPU usage over a recent time interval. The default interval is 20 seconds. For information about changing this interval, refer to the SBP (System Balancing Parameters) command.
Example 5
This example shows the command and response for the SORT HOLDRATE option:
A SORT HOLDRATE
  ---Mix-Pri--Hold Rate---- 10 ACTIVE ENTRIES SORT HOLDRATE --
  7628  50   72.76 %     (JKK) (JKK)WLM/SUSPENDER/TASK-0
  7635  50   71.52 %     (LEI) (LEI)WLM/SUSPENDER/TASK-7
  7630  50   70.88 %     (ADM) (ADM)WLM/SUSPENDER/TASK-2
  7631  50   67.45 %     (JMI) (JMI)WLM/SUSPENDER/TASK-3
  7633  50   60.69 %     (ADM) (ADM)WLM/SUSPENDER/TASK-5
  7636  50   57.81 %     (JMI) (JMI)WLM/SUSPENDER/TASK-8
  7637  50   56.37 %     (JEFF) (JEFF)WLM/SUSPENDER/TASK-9
  7634  50   43.26 %     (ADM) (ADM)WLM/SUSPENDER/TASK-6
  7632  50   31.41 %     (ADM) (ADM)WLM/SUSPENDER/TASK-4
  7629  50   22.59 %     (LAF) (LAF)WLM/SUSPENDER/TASK-1
